Sunday, April 14, 2013

Hadoop tools

Karmasphere

Abstraction layer and tool on top of Hadoop that enables to query Hadoop files using SQL. The tool is comprised of interactive web interface where users can create a project that will contain a set of queries. These queries can be shared and parametrised. The output can as well be used by tool like Tableau.
A drawback is that it doesn't solve the latency issue of Hadoop bu rather provide a tracker that shows which queries are running and which one are finished.

HBase

Open source, non-relational, NoSQL database in Java that seats on top of Hadoop and thus taking advantage of HDFS to store BigTables. It uses the programing concept of key-value representing data with "row"/"column-family"/"column"/"timsetamp"/"value"


Flume

Mahout

Hive

Pig


Wednesday, January 23, 2013

A/B Testing


What is A/B testing? It is conducting experiment to optimize customer experience. If the test is a success, we will then use the winning test to influence the behavior of the customer to our benefit (the one defined in the test).

An A/B has 4 steps:
1) Analyse the data
2) Form an hypothesis
3) Construct an experiment
4) Interpret the result


1) Analyse the data

Quantitative data tells where to test (get this data by behavior analysis...).
Qualitative data tells what to test (get this data via survey, feedback...).


2) Form an hypothesis

"If [variable], then [result] because [rational]."
[variable] = the element that is modified:
  • Call to action wording, size, color and placement
  • Headline of product description
  • Form length and types of fields
  • Layout and style of website
  • Product pricing and promotional offers
  • Images on landing and product pages
  • Amount of text on the page (short vs. long)
[result] = predicted outcome derived from the analysis of data is 1) (more sign-up, improved CTA, % increase, number goal etc...)
[rational] = what will be proven wrong if the test fails?

ex:
"If the navigation band is removed from the check-out page, then the conversion rate at each step will increase because our website analytics shows that traffic drops due to click on these links."

3) Experimentation

Every test have 3 parts:

  • Content: what does it says?
  • Design: how does it look?
  • Tech: how does it work?


4) Interpret the result

We want to answer the question: How confident are we that the results are not due to chance?

Mathematically, the conversion rate is represented by a binomial random variable, which is a fancy way of saying that it can have two possible values: conversion or non-conversion.
(The binomial distribution with parameters n and p is the discrete probability distribution of the number of successes in a sequence of n independent yes/no experiments, each of which yields success with probability p.)


To declare a winning we want the result of the test to be statistically significant at 95% which mean that only 5% probability that the result was due to chance.
This equate to having all the tested Conversion rate within 1.96 SE from the average conversion rate C.


To avoid doing repeated experiments, statistics has a neat trick in its toolbox. There is a concept called standard error, which tells how much deviation from average conversion rate (C) can be expected if this experiment is repeated multiple times. Smaller the deviation, more confident you can be about estimating true conversion rate.
For a given conversion rate (C) and number of trials (n), standard error is calculated as:

Standard Error (SE) = Square root of (C * (1-C) / n)

you can be sure with 95% confidence that your true conversion rate lies within this range: C % ± 2 * SE
(1.96 to be exact).

Testing the statistical significance corresponds to


p is the conversion rate that we are observing.


GOING INTO THE NITY DETAILS -- NEED CLEANING AND CLARIFICATION
http://www.slideshare.net/dj4b1n/ab-testing-pitfalls-and-lessons-learned-at-spotify-31935130

The likelihood of obtaining a certain value under a given distribution is measured by its p-value 

If there is a low likelihood that a change is due to chance alone, we call our results statistically significant
Statistical significance is measure by alpha which typical has a value of 5% or 1%.
Alternatively P(significant) = 0.05 or 0.01
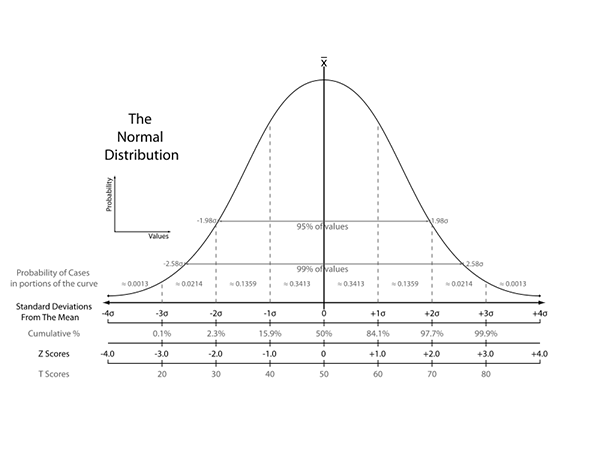
There is a conversion from alpha to z-Score.
The Z-score tells us how far a particular value is from the mean (and what the corresponding likelihood is)


Standard deviation (σ) tells us how spread out the numbers are


Test of statistical significance:
Null hypothesis is that the conversion rate of the control is no less than the conversion rate of the experiment:
H0: CR - CRc =<0
CRc is the conversion rate of the control.

Alternative hypothesis is that the experimental page has a higher conversion rate. This is what we want to test.
Conversion rate are normally distributed (conversion = success).
What we are looking for is if the difference between the two conversion rate is large enough to conclude that the treatment altered the behavior.

Random variable for the test will be: X = CR - CRc
Null hypothesis: H0: p-Value =<0

We use the Z-score to derive the p-value:
Z-Score = (CRc - Cre)/√(σc^2+σe^2)
p-Value = NORMDIST(Z-Score, 0, 1, TRUE)

if p-Value >95% then we can reject Null hypothesis and the A/B test is good to go!


Sunday, August 26, 2012

CIO: what's in it


Objective:

His objective is to increase data/information fluidity and accuratie in the company.  By fluidity mean the right information to the right people:
Right information: not just content but grain, frequency, medium of provision

Right people:
  • ·         Data analyst: role is to pre-chew data and provide added value analysis to decision makers. Added value analysis is not just what but why, so what and what to do with it
  • ·         Data scientist: role is to explore the data to find patterns using analytical tools (functions/formulas). Will perform both descriptive analysis (look at past events to perform segmentation, correlation, clustering, multi variate analysis) or predictive (build models to predict the future with regression, decision tree)
  • ·         Business audience:
    • o   Product managers
    • o   CRM
    • o   Marketing team
    • o   Finance
    • o   Ops
  • ·         Executive: need summarize yesterday data to track health of business vs projections/target and LY + create finance model for new opportunities

Role:

CIO role is to set the strategy appropriate to the maturity of the company, make it evolve and grow with the company.Strategy is around not just tools but as well teams and skill sets and infrastructure.

Why is it important to have a CIO?

Need to have a consistent and centralize data roadmap, enforce one data truth. If it is spread leads to growing pain
Once company reach a certain size then analysts and data scientists can be decentralize to business. CIO office is then just a service provider and is pure IT.

Team:


  • DWH: nucleus  of the data, where it is stored. Need a data acquisition team + Architect + Administrators Presentation team: In charge of distributing the data to the audience whether in the form of report dashboards or data sets
  • Data analyst: primary consumer, provide the added value on top of data
  • Data scientists


What would be the right organization for 150 people company today?
Cheap efficient fast turn-around.

  • Cheap: Plethora of free tools with Adoop/Hive/R and mySQL, or tools included in corporate licenses (Microsoft SQL servers with Analysis studio, PowerPivot etc) or cheap solution
  • Efficient: don’t address the enterprise approach in its entirety: create a robust, clean and agile DWH and plug on top departemental solution like Tableau, Quilk.
  • Fast turn-around: easy to learn, easy to maintain no deployment.

---
Technical
Architecture
Culture

Stored in one location, is clean, accurate and available on time.
Distribution of the data

Saturday, March 17, 2012

CRM Marketing Analytics


CRM analytics can provide :
·      Customer segmentation groupings (for example, at its simplest, dividing customers into those most and least likely to repurchase a product);
·      Profitability analysis (which customers lead to the most profit over time);
·      personalization (the ability to market to individual customers based on the data collected about them);
·      Event monitoring (for example, when a customer reaches a certain dollar volume of purchases);
·      What-if scenarios (how likely is a customer or customer category that bought one product to buy a similar one);
·      And predictive modeling (for example, comparing various product development plans in terms of likely future success given the customer knowledge base).

Web Site personalization: There are a number of personalization software products available, including those from Broadvision, ResponseLogic, and Autonomy.
In addition to use of the cookie, the technologies behind personalization include:
  • Collaborative filtering, in which a filter is applied to information from different sites to select relevant data that may apply to the specific e-commerce experience of a customer or specific group of customers
  • User profiling, using data collected from a number of different sites, which can result in the creation a personalized Web page before the user has been formally
  • Data analysis tools used to predict likely future interactions

Tuesday, March 13, 2012

Marketing Lift: Measuring Campaign effectiveness

How much more products or consumers are converting due to the marketing/advertising efforts.
A basic test/control methodology should be used to find out the lift in conversion rate due to advertising.

In simple words you found out the purchase intent without the advertising (Control group) and then with the advertising (Test Group). The % difference between the two provides the lift.

Lift is calculated as (test-control)/control

Sunday, February 5, 2012

Agile DWH vocabulary

http://www.agiledata.org/essays/dataWarehousingBestPractices.html

Iteration 0 Start with high level vision of the architecture
For each of the iteration of the architecture/delivery do some model storming: sketch one of the requirements from output up stream to data model,transformation and sourcing.
Test a the skeleton of the architecture to prove that the architecture will work. Go though accessing sources, that the ETL strategy works, and that the db regression testing works.
Prioritize the requirements, the one of the end users. Satisfy each of them and stitch the final solution together using regression testing.

A development approach is Test Driven Development (TDD): Break down the delivery of the iteration into sub-part, design a test for each of the sub-part, and develop the code to fulfill the test of the sub-part, then put together the code of each of the sub-part, integrate and perform regression testing.

Vocabulary:
refactoring
Regression testing
TDD