Monday, October 12, 2015

New comers of Big Data

Druid

http://druid.io
Druid (from Yahoo!) is a column-oriented open-source distributed data store designed to quickly ingest massive quantities of event data, making that data immediately available to queries - real-time data.
Fully deployed, Druid runs as a cluster of specialized nodes to support a fault-tolerant architecture where data is stored redundantly and there are multiple members of each node type. In addition, the cluster includes external dependencies for coordination (Apache ZooKeeper), storage of metadata (Mysql), and a deep storage facility (e.g., HDFS, Amazon S3, orApache Cassandra).

Druid's native query language is JSON over HTTP, although the community has contributed query libraries in numerous languages, including SQL.
Limited power compared to RDBMS/SQL and doesn't support joins or distinct count (inspired by Google Dremel). But very quick to answer predefined questions.

Presto 

https://prestodb.io
Presto (from Facebook) is an open source distributed SQL query engine for running interactive analytic queries against data sources of all sizes ranging from gigabytes to petabytes.
Presto was designed and written from the ground up for interactive analytics and approaches the speed of commercial data warehouses while scaling to the size of organizations like Facebook.
Presto allows querying data where it lives, including Hive, Cassandra, relational databases or even proprietary data stores. A single Presto query can combine data from multiple sources, allowing for analytics across your entire organization.

Samza

Apache Samza is a distributed stream processing framework. It uses Apache Kafka for messaging, and Apache Hadoop YARNto provide fault tolerance, processor isolation, security, and resource management.

Drill

https://drill.apache.org
Schema-free SQL Query Engine for Hadoop, NoSQL and Cloud Storage.Drill is designed from the ground up to support high-performance analysis on the semi-structured and rapidly evolving data (including JSON) coming from modern Big Data applications, while still providing the familiarity and ecosystem of ANSI SQL.
Dynamic queries on self-describing data in files (such as JSON, Parquet, text) and HBase tables, without requiring metadata definitions in the Hive metastore.
Drill supports a variety of NoSQL databases and file systems, including HBase, MongoDB, MapR-DB, HDFS, MapR-FS, Amazon S3, Azure Blob Storage, Google Cloud Storage, Swift, NAS and local files. A single query can join data from multiple datastores. For example, you can join a user profile collection in MongoDB with a directory of event logs in Hadoop.

Sunday, April 5, 2015

Lambda architecture

http://lambda-architecture.net

eric baldeschwieler

The Lambda Architecture aims to satisfy the needs for a robust system that is fault-tolerant, both against hardware failures and human mistakes, being able to serve a wide range of workloads and use cases, and in which low-latency reads and updates are required. The resulting system should be linearly scalable, and it should scale out rather than up.

  1. All data entering the system is dispatched to both the batch layer and the speed layer for processing. 
  2. The batch layer has two functions: (i) managing the master dataset (an immutable, append-only set of raw data), and (ii) to pre-compute the batch views. 
  3. The serving layer indexes the batch views so that they can be queried in low-latency, ad-hoc way. 
  4. The speed layer compensates for the high latency of updates to the serving layer and deals with recent data only. 
  5. Any incoming query can be answered by merging results from batch views and real-time views.

Example realtime application:
Recommender
Newsfeed


Message bus like Kafka, Flume, Scribe
Realtime engine: Kafka, Storm, Samza, DataTorent
Serving Store: Cassandra, MySQL
Service: Slider, Twill, Hbase, Sqooq

Wednesday, April 1, 2015

AWS stack

http://en.wikipedia.org/wiki/Amazon_Web_Services#List_of_products

Database: http://aws.amazon.com/products/?nc2=h_ql_summits#databases-1
Analytics: http://aws.amazon.com/products/?nc2=h_ql_summits#analytics-1
Compute: http://aws.amazon.com/products/?nc2=h_ql_summits#compute-1
Storage: http://aws.amazon.com/products/?nc2=h_ql_summits#storage-1

Thursday, March 19, 2015

Machine Learning

http://cs229.stanford.edu/materials.html
https://www.youtube.com/watch?v=UzxYlbK2c7E

Four parts of the class:

  • Supervise learning: providing the computer existing datasets that have the right answers.
    • Regression (continuous data point) or classification (discrete data) are example of supervise learning
  • Learning theory: understand how and why learning algorithm work (how to prove that algorithm that reads zip code works); what algorithm can approximate function, what size for the learning data we need.
  • Unsupervised learning: being given a dataset and ask to find interesting structure (vs. giving the right answer)
    • Clustering is one example
  • Reinforcement learning: asked to make a sequence of decision over time;
    • reinforce good behavior vs bad behavior: example flying helicopter: good behavior doesn't crash.

Thursday, January 29, 2015

About big data

From: http://www.slideshare.net/timoelliott/ukisug2014-big-data-presentation

Types of big data:


  • Human generated data:
    • Swipe of credit card
    • Scan of bar code
    • Actions captured on mobile phones
  • Machine generated data:
    • Data logers
    • Sensors


From hindsight, to insight to foresight:

  • Descriptive: what did happen
  • Diagnostic: why did it happen
  • Predictive: will it happen again
  • Prescriptive: how can we make it happen
Types of data (sorted by % use in descending order) - ref2:
  • Time series
  • Business transactions
  • Geospatial/location
  • Graph (network)
  • Clickstream
  • Health records
  • Sensor
  • Image
  • Genomic
According to Gartner (Ref3):
  • Rising up to the peak of inflated expectation:
    • Data science
    • Predictive analytics
  • In the downslope of desillusion
    • Complexe event processing
    • Big Data
    • Content analytics

Big data can be used for:
  • Engage and empower data consumers:
    • Discovering new business opportunities
    • Identify new product opportunities
    • More reliable decision making
  • Plan and optimize: Improve operation efficiency
  • Personalize experience
Data lake: is a storage repository that holds a vast amount of raw data in its native format until it is needed.
HTAP = OLTP + OLAP = new generation of in-memory data platforms that can perform both online transaction processing (OLTP) and online analytical processing (OLAP) without requiring data duplication.

Ref 2: from http://www.paradigm4.com/wp-content/uploads/2014/06/P4-data-scientist-survey-FINAL.pdf
Ref 3: Gartner 2014 hype cycle: http://www.gartner.com/newsroom/id/2819918

Wednesday, June 25, 2014

Hadoop - Beyond Map Reduce, Pig and Hive

Hadoop 2.0

6/8/14 - Hadoop Maturity Summit: http://gigaom.com/2014/06/08/hadoop-maturity-summits/

Yarn

Part of Hadoop 2.0 Yarn (Yet Another Resource Manager) is a resource manager that enable non MapReduce jobs to work on Hadoop and leverage HDFS. YARN provide a generic resource management framework for implementing distributed applications.
MapReduce only allows batch processing, but YARN unlock the real time data processing on Hadoop.

Spark - http://projects.apache.org/projects/spark.html

Apache Spark is a fast and general engine for large-scale data processing. It offers high-level APIs in Java, Scala and Python as well as a rich set of libraries including stream processing, machine learning, and graph analytics.
Spark powers a stack of high-level tools including Shark for SQL, MLib for machine learning , GraphX and Spark Streaming.

MLib

MLib is spark's scallable machine learning library. It fits into Spar's APIs and interoperates with NumPy in Python. It can leverage any Hadoop data source (HDFS, HBase or local files).
Machine Learning Library (MLib) guide: http://spark.apache.org/docs/latest/mllib-guide.html

Cassandra - http://cassandra.apache.org/

Cassandra is a massively scalable open source NoSQL. Cassandra is perfect for managing large amounts of structured, semi-structured, and unstructured data across multiple data centers and the cloud. Cassandra delivers continuous availability, linear scalability, and operational simplicity across many commodity servers with no single point of failure, along with a powerful dynamic data model designed for maximum flexibility and fast response times.
Cassandra sports a “masterless” architecture meaning all nodes are the same.

Kafka - http://kafka.apache.org/

Kafka is a distributed pub/sub and message queuing system.
Kafka consumes streams called topics that are partitioned and replicated across multiple machine named brokers.
A single Kafka broker can handle hundreds of megabytes of reads and writes per second from thousands of clients. Kafka is designed to allow a single cluster to serve as the central data backbone for a large organization. It can be elastically and transparently expanded without downtime. Data streams are partitioned and spread over a cluster of machines to allow data streams larger than the capability of any single machine and to allow clusters of co-ordinated consumers. Kafka has a modern cluster-centric design that offers strong durability and fault-tolerance guarantees. Messages are persisted on disk and replicated within the cluster to prevent data loss. Each broker can handle terabytes of messages without performance impact.
Basic messaging terminology:

  • Kafka maintains feeds of message in categories called topics.
  • Process that publish message to a Kafka topic is called producer.
  • Process that subscribes to topics and process the feed of a published message is called consumer.
  • Kafka is run in a cluster comprised of one or more servers each of which is called a broker.


Storm
http://vimeo.com/40972420

HBase
http://hbase.apache.org/book.html#other.info.videos
Use Apache HBase™ when you need random, realtime read/write access to your Big Data. This project's goal is the hosting of very large tables -- billions of rows X millions of columns -- atop clusters of commodity hardware. Apache HBase is an open-source, distributed, versioned, non-relational database modeled after Google's Bigtable. Apache HBase provides Bigtable-like capabilities on top of Hadoop and HDFS.
HDFS is a distributed file system that is well suited for the storage of large files. Its documentation states that it is not, however, a general purpose file system, and does not provide fast individual record lookups in files. HBase, on the other hand, is built on top of HDFS and provides fast record lookups (and updates) for large tables.

Both Cassandra and HBase are NoSQL databases, a term for which you can find numerous definitions. Generally, it means you cannot manipulate the database with SQL. However, Cassandra has implemented CQL (Cassandra Query Language), the syntax of which is obviously modeled after SQL. Cassandra uses the Gossip protocol for internode communications, and Gossip services are integrated with the Cassandra software. HBase relies on Zookeeper -- an entirely separate distributed application -- to handle corresponding tasks.

Sunday, June 22, 2014

Hadoop - Intro

http://youtu.be/d2xeNpfzsYI

Map Reduce process: 1)Map (key:value pair)-- 2)Shuffle-sort (sort, computation phase)-- 3)Reduce (aggregate results)


Saturday, April 5, 2014

Toolcase


Front end: HTML/CSS/JS, Wireframing

Backend: SSJS, DB, Framework, Data Pipelines

APIs: Client-side templating, HTTP, SOA/REST/JSON

URI Uniform Resource Identifier

Is made of the URL (Uniform Resource Locator) and URN (Uniform Resource Name)

Syntax: URI consists of a URI scheme name (such as "HTTP","ftp","mailto","crid","file") followed by a colon character, then a scheme specific part. More at http://en.wikipedia.org/wiki/URI_scheme#Generic_syntax
http://en.wikipedia.org/wiki/URI#Examples_of_URI_references

"http" specifies the 'scheme' name, "en.wikipedia.org" is the 'authority', "/wiki/URI" the 'path' pointing to this article, and "#Examples_of_URI_references" is a 'fragment' pointing to this section.

 REST API:

  • the base URI for the web API, such as http://example.com/resources/
  • the Internet media type of the data supported by the web API. This is often JSON but can be any other valid Internet media type provided that it is a valid hypertext standard.
  • the set of operations supported by the web API using HTTP methods (e.g., GET, PUT, POST, or DELETE).
  • The API must be hypertext driven.[16]
RESTful web API HTTP methods
ResourceGETPUTPOSTDELETE
Collection URI, such as http://example.com/resourcesList the URIs and perhaps other details of the collection's members.Replace the entire collection with another collection.Create a new entry in the collection. The new entry's URI is assigned automatically and is usually returned by the operation.Delete the entire collection.
Element URI, such as http://example.com/resources/item17Retrieve a representation of the addressed member of the collection, expressed in an appropriate Internet media type.Replace the addressed member of the collection, or if it doesn't exist, createit.Not generally used. Treat the addressed member as a collection in its own right andcreate a new entry in it.Delete the addressed member of the collection.
productService.GetProduct("1")
http://someurl/product/1


REST(ful) API is an API that follows the REST architectural style.

REST stands for Representational State Transfer,. Its HTTP version uses the four HTTP methods GET, POST, PUT and DELETE to execute different operations.

A RESTful web service is a web API implemented using HTTP and REST principles. It is a collection of resources, with four defined aspects:

The following table shows how the HTTP methods are typically used to implement a web API.


Where SOAP tries to model the exchange between client and server as calls to objects, REST tries to be faithful to the web domain. So when calling a web service written in SOAP, you may write
in REST, you may call a url with HTTP GET:

Tuesday, June 25, 2013

New BI Comers

New ETL player:
Lavastorm Analytics:
Provide tools to analyst to extract, transform, clean and manipulate data to deliver analysis.
The strength is that there is no need for programing, use visual based application to assemble blocks representing transformation rules (like modern ETL tools) with output be caned reports/dashboards, alerts, case management module with embedded logic.

New DB:
NeoTechnology:
New type of database technology that marries NoSQL database (i.e. direct interface with Java and online world, schema less) with VLDB and its data storage and management capabilities.

New light BI:
Jaspersoft:

LogiXML:

Sunday, April 14, 2013

Hadoop tools

Karmasphere

Abstraction layer and tool on top of Hadoop that enables to query Hadoop files using SQL. The tool is comprised of interactive web interface where users can create a project that will contain a set of queries. These queries can be shared and parametrised. The output can as well be used by tool like Tableau.
A drawback is that it doesn't solve the latency issue of Hadoop bu rather provide a tracker that shows which queries are running and which one are finished.

HBase

Open source, non-relational, NoSQL database in Java that seats on top of Hadoop and thus taking advantage of HDFS to store BigTables. It uses the programing concept of key-value representing data with "row"/"column-family"/"column"/"timsetamp"/"value"


Flume

Mahout

Hive

Pig


Wednesday, January 23, 2013

A/B Testing


What is A/B testing? It is conducting experiment to optimize customer experience. If the test is a success, we will then use the winning test to influence the behavior of the customer to our benefit (the one defined in the test).

An A/B has 4 steps:
1) Analyse the data
2) Form an hypothesis
3) Construct an experiment
4) Interpret the result


1) Analyse the data

Quantitative data tells where to test (get this data by behavior analysis...).
Qualitative data tells what to test (get this data via survey, feedback...).


2) Form an hypothesis

"If [variable], then [result] because [rational]."
[variable] = the element that is modified:
  • Call to action wording, size, color and placement
  • Headline of product description
  • Form length and types of fields
  • Layout and style of website
  • Product pricing and promotional offers
  • Images on landing and product pages
  • Amount of text on the page (short vs. long)
[result] = predicted outcome derived from the analysis of data is 1) (more sign-up, improved CTA, % increase, number goal etc...)
[rational] = what will be proven wrong if the test fails?

ex:
"If the navigation band is removed from the check-out page, then the conversion rate at each step will increase because our website analytics shows that traffic drops due to click on these links."

3) Experimentation

Every test have 3 parts:

  • Content: what does it says?
  • Design: how does it look?
  • Tech: how does it work?


4) Interpret the result

We want to answer the question: How confident are we that the results are not due to chance?

Mathematically, the conversion rate is represented by a binomial random variable, which is a fancy way of saying that it can have two possible values: conversion or non-conversion.
(The binomial distribution with parameters n and p is the discrete probability distribution of the number of successes in a sequence of n independent yes/no experiments, each of which yields success with probability p.)


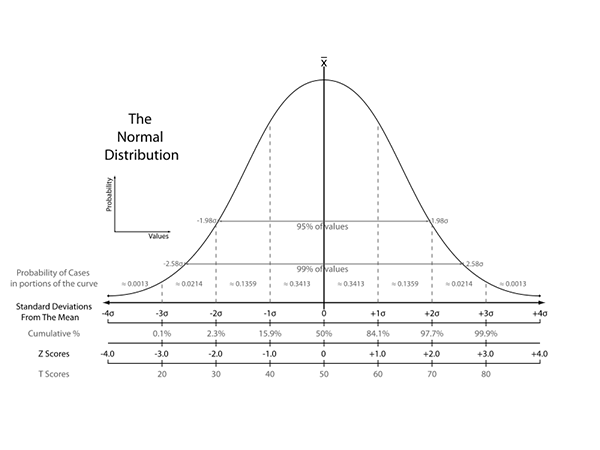
To declare a winning we want the result of the test to be statistically significant at 95% which mean that only 5% probability that the result was due to chance.
This equate to having all the tested Conversion rate within 1.96 SE from the average conversion rate C.


To avoid doing repeated experiments, statistics has a neat trick in its toolbox. There is a concept called standard error, which tells how much deviation from average conversion rate (C) can be expected if this experiment is repeated multiple times. Smaller the deviation, more confident you can be about estimating true conversion rate.
For a given conversion rate (C) and number of trials (n), standard error is calculated as:

Standard Error (SE) = Square root of (C * (1-C) / n)

you can be sure with 95% confidence that your true conversion rate lies within this range: C % ± 2 * SE
(1.96 to be exact).

Testing the statistical significance corresponds to


p is the conversion rate that we are observing.


GOING INTO THE NITY DETAILS -- NEED CLEANING AND CLARIFICATION
http://www.slideshare.net/dj4b1n/ab-testing-pitfalls-and-lessons-learned-at-spotify-31935130

The likelihood of obtaining a certain value under a given distribution is measured by its p-value 

If there is a low likelihood that a change is due to chance alone, we call our results statistically significant
Statistical significance is measure by alpha which typical has a value of 5% or 1%.
Alternatively P(significant) = 0.05 or 0.01
There is a conversion from alpha to z-Score.
The Z-score tells us how far a particular value is from the mean (and what the corresponding likelihood is)


Standard deviation (σ) tells us how spread out the numbers are


Test of statistical significance:
Null hypothesis is that the conversion rate of the control is no less than the conversion rate of the experiment:
H0: CR - CRc =<0
CRc is the conversion rate of the control.

Alternative hypothesis is that the experimental page has a higher conversion rate. This is what we want to test.
Conversion rate are normally distributed (conversion = success).
What we are looking for is if the difference between the two conversion rate is large enough to conclude that the treatment altered the behavior.

Random variable for the test will be: X = CR - CRc
Null hypothesis: H0: p-Value =<0

We use the Z-score to derive the p-value:
Z-Score = (CRc - Cre)/√(σc^2+σe^2)
p-Value = NORMDIST(Z-Score, 0, 1, TRUE)

if p-Value >95% then we can reject Null hypothesis and the A/B test is good to go!


Sunday, August 26, 2012

CIO: what's in it


Objective:

His objective is to increase data/information fluidity and accuratie in the company.  By fluidity mean the right information to the right people:
Right information: not just content but grain, frequency, medium of provision

Right people:
  • ·         Data analyst: role is to pre-chew data and provide added value analysis to decision makers. Added value analysis is not just what but why, so what and what to do with it
  • ·         Data scientist: role is to explore the data to find patterns using analytical tools (functions/formulas). Will perform both descriptive analysis (look at past events to perform segmentation, correlation, clustering, multi variate analysis) or predictive (build models to predict the future with regression, decision tree)
  • ·         Business audience:
    • o   Product managers
    • o   CRM
    • o   Marketing team
    • o   Finance
    • o   Ops
  • ·         Executive: need summarize yesterday data to track health of business vs projections/target and LY + create finance model for new opportunities

Role:

CIO role is to set the strategy appropriate to the maturity of the company, make it evolve and grow with the company.Strategy is around not just tools but as well teams and skill sets and infrastructure.

Why is it important to have a CIO?

Need to have a consistent and centralize data roadmap, enforce one data truth. If it is spread leads to growing pain
Once company reach a certain size then analysts and data scientists can be decentralize to business. CIO office is then just a service provider and is pure IT.

Team:


  • DWH: nucleus  of the data, where it is stored. Need a data acquisition team + Architect + Administrators Presentation team: In charge of distributing the data to the audience whether in the form of report dashboards or data sets
  • Data analyst: primary consumer, provide the added value on top of data
  • Data scientists


What would be the right organization for 150 people company today?
Cheap efficient fast turn-around.

  • Cheap: Plethora of free tools with Adoop/Hive/R and mySQL, or tools included in corporate licenses (Microsoft SQL servers with Analysis studio, PowerPivot etc) or cheap solution
  • Efficient: don’t address the enterprise approach in its entirety: create a robust, clean and agile DWH and plug on top departemental solution like Tableau, Quilk.
  • Fast turn-around: easy to learn, easy to maintain no deployment.

---
Technical
Architecture
Culture

Stored in one location, is clean, accurate and available on time.
Distribution of the data

Saturday, March 17, 2012

CRM Marketing Analytics


CRM analytics can provide :
·      Customer segmentation groupings (for example, at its simplest, dividing customers into those most and least likely to repurchase a product);
·      Profitability analysis (which customers lead to the most profit over time);
·      personalization (the ability to market to individual customers based on the data collected about them);
·      Event monitoring (for example, when a customer reaches a certain dollar volume of purchases);
·      What-if scenarios (how likely is a customer or customer category that bought one product to buy a similar one);
·      And predictive modeling (for example, comparing various product development plans in terms of likely future success given the customer knowledge base).

Web Site personalization: There are a number of personalization software products available, including those from Broadvision, ResponseLogic, and Autonomy.
In addition to use of the cookie, the technologies behind personalization include:
  • Collaborative filtering, in which a filter is applied to information from different sites to select relevant data that may apply to the specific e-commerce experience of a customer or specific group of customers
  • User profiling, using data collected from a number of different sites, which can result in the creation a personalized Web page before the user has been formally
  • Data analysis tools used to predict likely future interactions

Tuesday, March 13, 2012

Marketing Lift: Measuring Campaign effectiveness

How much more products or consumers are converting due to the marketing/advertising efforts.
A basic test/control methodology should be used to find out the lift in conversion rate due to advertising.

In simple words you found out the purchase intent without the advertising (Control group) and then with the advertising (Test Group). The % difference between the two provides the lift.

Lift is calculated as (test-control)/control

Sunday, February 5, 2012

Agile DWH vocabulary

http://www.agiledata.org/essays/dataWarehousingBestPractices.html

Iteration 0 Start with high level vision of the architecture
For each of the iteration of the architecture/delivery do some model storming: sketch one of the requirements from output up stream to data model,transformation and sourcing.
Test a the skeleton of the architecture to prove that the architecture will work. Go though accessing sources, that the ETL strategy works, and that the db regression testing works.
Prioritize the requirements, the one of the end users. Satisfy each of them and stitch the final solution together using regression testing.

A development approach is Test Driven Development (TDD): Break down the delivery of the iteration into sub-part, design a test for each of the sub-part, and develop the code to fulfill the test of the sub-part, then put together the code of each of the sub-part, integrate and perform regression testing.

Vocabulary:
refactoring
Regression testing
TDD

Sunday, July 17, 2011

Analytics Map


Open in new page

Web Analytics

Clickmap
Page view
Unique visitor
Visitor loyalty vs. visitor recency
 Length of visit
Avg time on site
Bounce rate
Organic vs paid search


Goad Conversion rate:
A conversion occurs when a visitor reaches a goal. Goal Conversion Rate is the percentage of visits which resulted in a conversion to at least one of your goals.
There are three kinds of goals: URL Destination goals, Time on Site goals, and Pages per Visit goals.

Conversion rate, in percentage, equals Outcomes divided by Unique Visitors during a particular time period.


Packet Sniffer 


To overcome the difficulty of tracking dynamic pages (pages with Ajax, Video, Flash) we can use event tracking


Voice of the People  


A/B and multivariate test.
Objective is to change the behavior of customer on web site by making some changes to a specific page. Results are compared vs. a control page which is un-altered.
A/B test: one variable change (but can be different version to be compared like different size of a button (size is the variable)
Multivariate: change more than one variable at the time

Example of elements that are tested in A/B tests:

  • Call to action wording, size, color and placement
  • Headline of product description
  • Form length and types of fields
  • Layout and style of website
  • Product pricing and promotional offers
  • Images on landing and product pages
  • Amount of text on the page (short vs. long)
Ether for A/B or multivariate the goal needs to be defined in advanced: what is the desirable action of the customer that the change is trying to induce.
To be declared as a success we also need to make sure that the result is statistically significant it didn't occurred by accident but rather reflect a repeatable pattern - http://20bits.com/article/statistical-analysis-and-ab-testing


PPC = pay per cl

CTR = Click Through Rate

Hadoop

Hadapt
The company’s product approach is a full integration of the open source parallel data processing framework, Apache Hadoop™. Hadapt is adapting and expanding the Hadoop architecture to bring a more complete SQL interface, a patent-pending Adaptive Query Execution™ capability, and a hybrid storage engine to handle structured as well as unstructured data in a single platform.
Datasheet here
White paper here

Thursday, May 5, 2011

Agile BI

Notes on Forrester 2011 Trends and beyond
90s was the time of silos development, 2000s the decade of centralization and 2010s the decade of agile

Centralization of BI address issues related to "one single vision of the truth" and provide uniform tools across the enterprise. The problem is that with consolidation comes additional processes, administration and middle people to go through to reach knowledgeable player/developers

Thus the idea of agility on top of centralization. The idea is to be flexible enough to address unique problematic of evolving business processes which induce small changes requests. These type of requests don't go well with traditional SDLC (software development lifecycle). BPM suite seem to be well suited to agile development. Business must have ownership of the BI initiative. Create a hub and spoke environment i.e. what needs to be centralize and what needs to belong to satellites.

Forester define 4 major sub-category to agility:

  1. Automation: Free up human resource and process time by automating what can. Will leave more time for custom/last minute/ad'hoc request. Example: Auto information discovery - data profiling -> speedup ETL/Schema built; All stages of BI (ETL, data management, reporting) in one tool can enable life-cycle automation; optimize usage/speed/availability for most used elements/entities/tables/reports; See and share what other do; Auto decision 
  2. Unify toolset: have a common choice across company for BI tools. Example of unification: SaaS logical linking to data; structure, unstructured, predictive, complex data structure like unbalanced, ragged or sparse hierarchy
  3. Pervasive: Spread widely information; whenever, however, whatever
  4. Limitless: adaptive DM, multi-dim
TIBCO Spotfire
Endica
Quiterian
Attivio